TradingView Review 2026: Opinions, Pricing and How It Works
Charts, indicators, Pine Script, screeners and alerts: our complete TradingView review, with plan prices and which one to choose.
What TradingView is and why millions of traders use it
TradingView is a financial market analysis platform that runs in the browser, on smartphones and as a desktop application. Founded in 2011, it quickly became the reference tool for chart analysis: every month tens of millions of traders and investors around the world use it, from beginners to professionals.
The reason for its success is simple: in one place it offers advanced charts on stocks, indices, forex, commodities, ETFs, bonds and cryptocurrencies from almost every exchange in the world, with hundreds of indicators, drawing tools, screeners, alerts and a very active community that publishes analysis and custom indicators.
One important point to clarify straight away: TradingView is not a broker. It is an analysis tool. To buy and sell you can connect a compatible broker account to the chart, or use TradingView only for analysis and trade on your broker's platform, such as MetaTrader or cTrader.
How TradingView works: the Supercharts
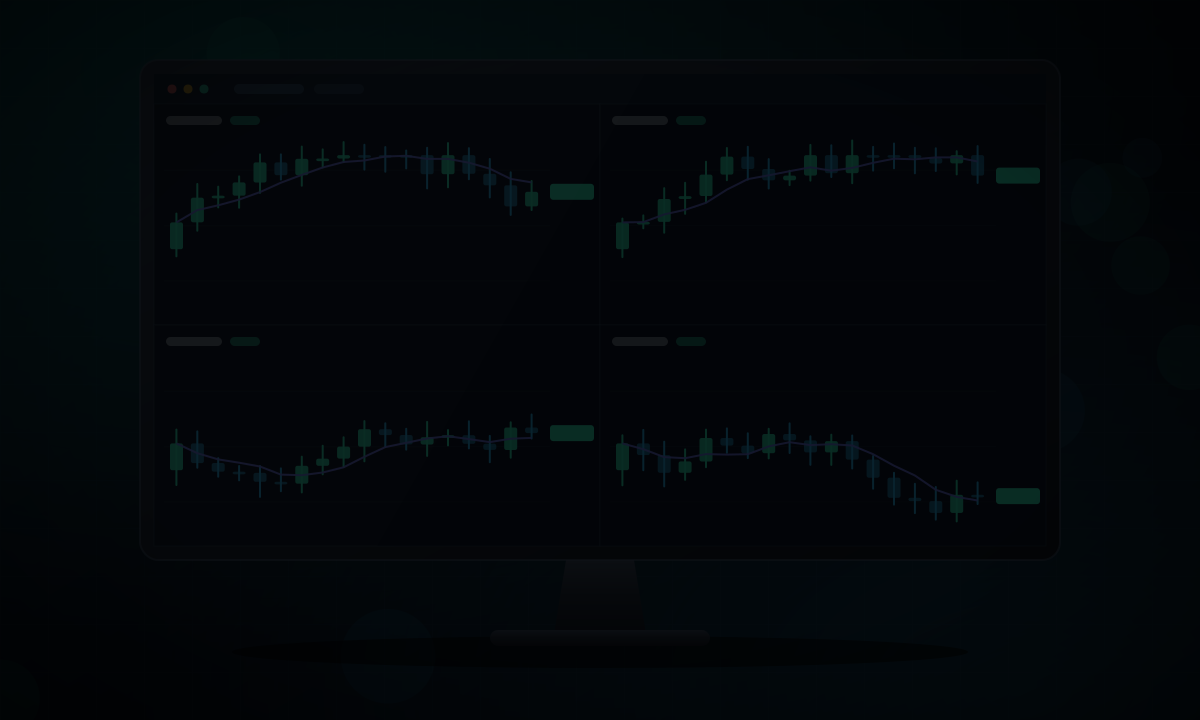
The heart of TradingView is Supercharts, the platform's interactive charts. They are fast, smooth even with lots of data and customisable in every detail: colours, scales, trading sessions, time zones and saved templates.
Besides classic candlesticks, bar and line charts, TradingView offers advanced chart types such as Heikin Ashi, Renko, Kagi, Point & Figure and Line Break. Timeframes range from one minute (one second on higher plans) to monthly, and you can create custom intervals.
There are more than a hundred drawing tools: trend lines, channels, Fibonacci retracements and extensions, Gann tools, harmonic patterns, notes and the handy long/short position tool to calculate a trade's risk and reward in advance. With Bar Replay you can rewind the chart and replay the market candle by candle, great practice for testing a strategy by hand.
On paid plans you can place several charts side by side in the same tab (from 2 to 16, depending on the plan) and sync them by symbol, timeframe and crosshair: the most convenient way to follow several instruments, or the same instrument on several timeframes, at once.
Indicators and Pine Script: customising your analysis
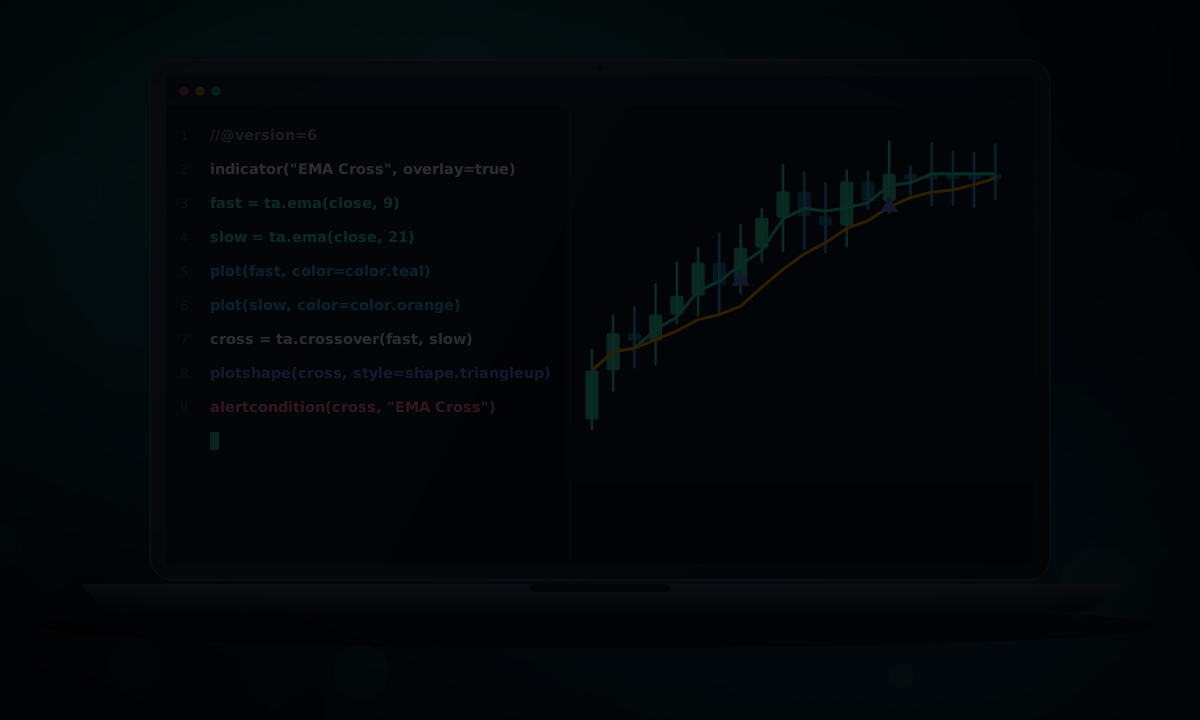
TradingView includes more than 400 ready-made indicators and strategies: moving averages, RSI, MACD, Bollinger Bands, Ichimoku, VWAP, volume profile and many more. On top of these there are over 100,000 scripts published for free by the community, which you can add to the chart with one click.
If you want to go further, there is Pine Script, TradingView's programming language, now on version 6. It is designed for traders rather than programmers: with a few lines you can create a custom indicator, a strategy with its backtest or an alert condition. The code runs on TradingView's servers, so there is nothing to install.
Compared with MetaTrader's MQL4/MQL5 and cTrader's C#, Pine Script is much easier to learn, but it is built for analysis and alerts, not for automatically executing orders with the broker: traders who want fully automated trading usually connect TradingView alerts to an external service via webhook, or stay on MetaTrader or cTrader.
Screeners and watchlists: finding opportunities
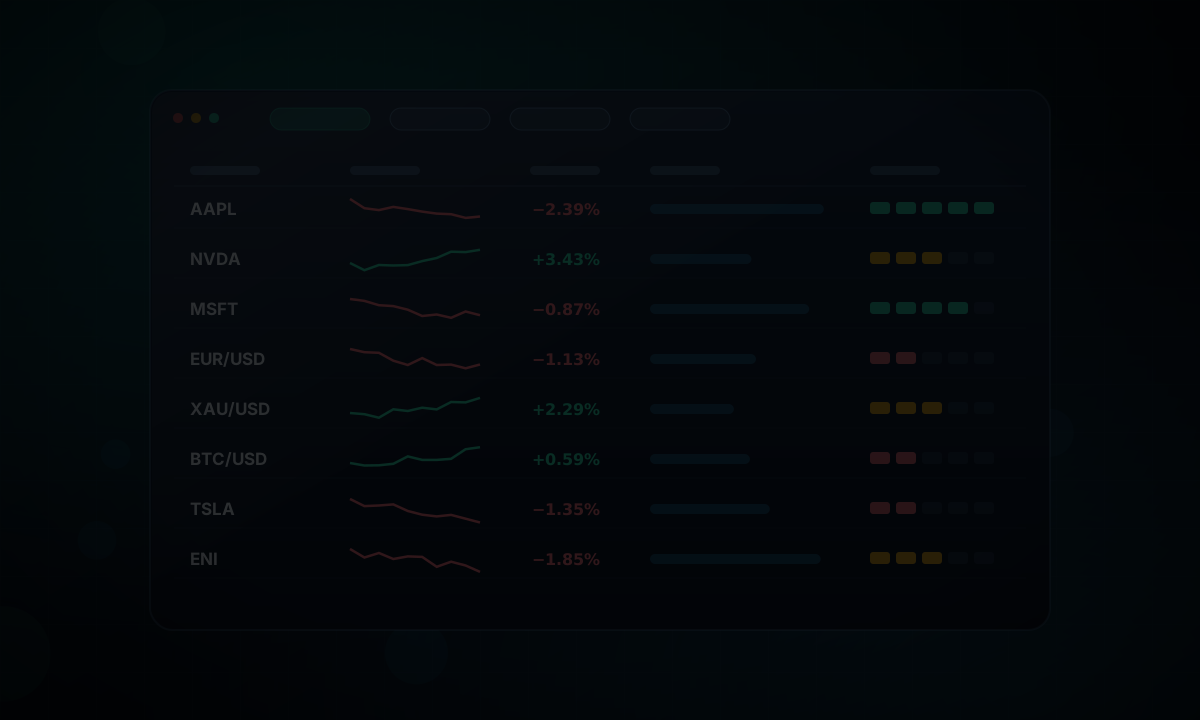
TradingView's screener lets you filter thousands of instruments in seconds. There are dedicated screeners for stocks, ETFs, forex, crypto and bonds, with dozens of criteria: percentage change, volume, market cap, fundamentals (earnings, dividends, P/E ratio) and technical signals such as moving average crossovers or the summary technical rating.
Watchlists keep the instruments you care about under control, with price, change and a mini chart always at hand. You can create several lists (forex, stocks, crypto…), colour-code them and sync them between computer and smartphone. The economic and earnings calendars complete the picture, so you know in advance when market-moving data is released.
Alerts: never miss an important move
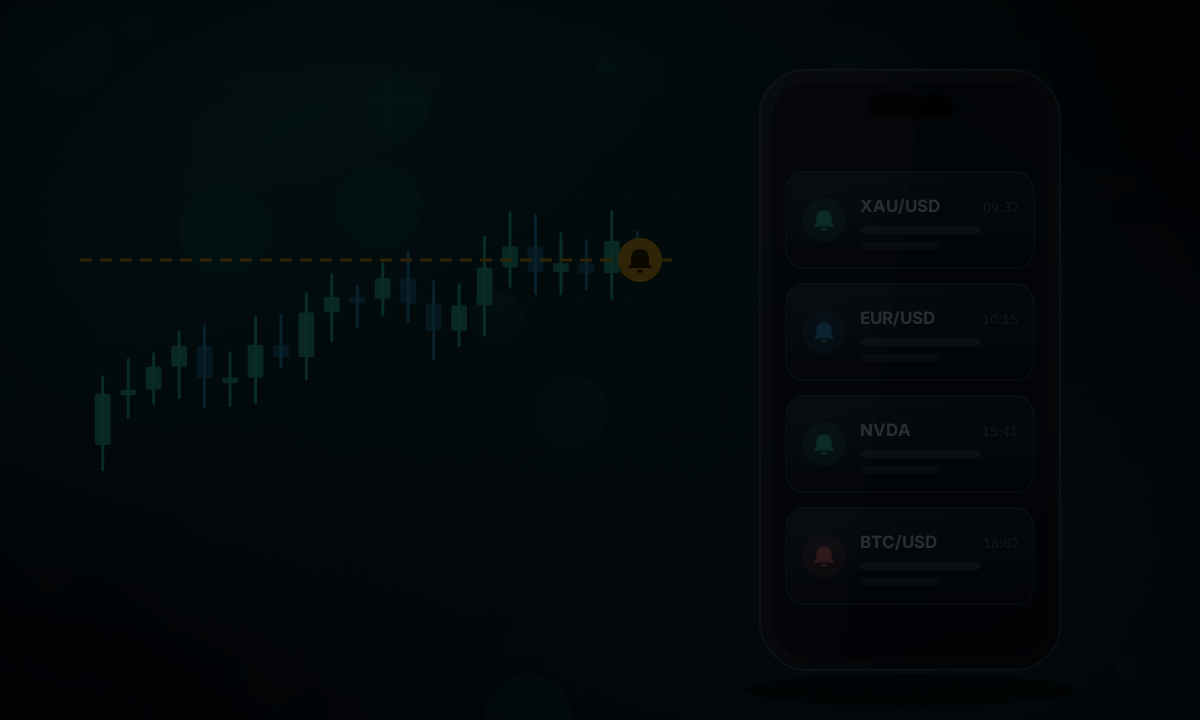
Alerts are one of TradingView's most useful features: they notify you when price reaches a level, when an indicator gives a signal (for example a moving average crossover or an overbought RSI) or when price touches a line you have drawn on the chart.
Notifications arrive in the app, by email, as a pop-up on your computer and, on paid plans, via webhook to other services. The number of active alerts depends on the plan: the free plan has only a few, while higher plans reach hundreds or thousands. For an active trader this is often the main reason to upgrade.
Community, apps and trading from the chart
TradingView is also a social network for traders: you can follow other users, read trading ideas published with annotated charts and join discussions. It is a useful source of inspiration, but take it with a critical eye: published ideas are not investment advice and their quality varies a lot.
The iOS and Android app is among the best in the industry: full charts, watchlists, alerts and news synced with your computer. There is also a desktop app for Windows, macOS and Linux, convenient for working with several monitors. The Paper Trading feature also lets you practise with virtual money directly on the chart.
Finally, you can connect an account with one of the integrated brokers and send orders straight from the chart. Before doing so, always check that the broker is regulated in your country, and remember that trading conditions and costs depend on the broker, not on TradingView.
TradingView pricing: plans and costs in 2026
TradingView offers a free plan (Basic) and four paid plans: Essential, Plus, Premium and Ultimate. The price depends on the subscription length: annual billing saves up to about 17% compared with monthly. Essential, Plus and Premium normally include a 30-day free trial.
Here are the main differences between the plans. Prices are monthly, in US dollars, indicative, and may change during seasonal promotions:
| Plan | Price (monthly) | Charts per tab | Indicators per chart | Active alerts | Historical bars |
|---|---|---|---|---|---|
| Basic | Free | 1 | 2 | 3 (price) | 5,000 |
| Essential | $14.95 | 2 | 5 | 20 | 10,000 |
| Plus | $34.95 | 4 | 10 | 100 | 10,000 |
| Premium | $69.95 | 8 | 25 | 400 | 20,000 |
| Ultimate | $239.95 | 16 | 50 | 1,000 | 40,000 |
Indicative prices and limits as of November 2026: always check the current terms on TradingView's website. Real-time data for some exchanges is charged separately.
TradingView free or paid: which plan to choose
The free Basic plan is great to start with: full charts, the main indicators and the screener. Its limits show up quickly, though: only 2 indicators per chart, few alerts, one chart per tab and ads. For occasional market analysis it may be enough.
Essential is the natural first step for regular traders: no ads, 2 charts side by side, 5 indicators and 20 alerts. Plus suits swing traders who follow several instruments and want more alerts and saved layouts. Premium is designed for active and intraday traders: 8 charts per tab, 400 alerts, deeper history and second-based timeframes. Ultimate is aimed at professionals who need the highest limits.
Our advice: start with the free version, use the 30-day trial to test the plan you are interested in and, if TradingView becomes your main tool, consider the annual subscription, which costs less. With our offer, new customers also get $15 off their first subscription.
TradingView pros and cons: our opinion
Pros: some of the best charts available in terms of quality and speed; coverage of almost every market in the world; more than 400 built-in indicators and over 100,000 community scripts; Pine Script is easy to learn; powerful alerts; excellent, synced mobile app; interface available in many languages; the free plan is already very useful.
Cons: the free plan has tight limits (2 indicators, few alerts) and shows ads; the top plans are expensive; real-time data for some exchanges costs extra; trading from the chart depends on the integrated brokers; fully automated order execution requires external tools.
Overall, TradingView is the most complete and easy-to-use technical analysis platform available today. For most traders it offers excellent value for money, especially with annual billing.
TradingView vs MetaTrader and cTrader: final verdict
MetaTrader 4/5 and cTrader are trading platforms provided by brokers: they are mainly used to execute orders and run trading robots (Expert Advisors and cBots). TradingView, on the other hand, was built for analysis: its charts, indicators, screeners and community are a step above, but order execution always goes through a broker.
That is why many traders use both: they analyse on TradingView and trade on MetaTrader or cTrader, or connect an integrated broker to TradingView to do everything from the same chart. To learn more about broker platforms, read our guides to MetaTrader 4 vs 5 and to cTrader.
The verdict: TradingView is the analysis tool we recommend to anyone who trades, from beginners to professionals. Start with the free plan and, when you need it, move to a paid plan taking advantage of our $15 discount for new customers. Always remember that trading involves risk and that no analysis tool guarantees profits.
Frequently asked questions
Is TradingView free?
Yes, TradingView has a free plan (Basic) with full charts, the main indicators and the screener. It does have limits: 2 indicators per chart, few alerts, one chart per tab and ads. Paid plans remove these limits.
How much does TradingView cost?
As of November 2026, with monthly billing the paid plans cost about $14.95 (Essential), $34.95 (Plus), $69.95 (Premium) and $239.95 (Ultimate) per month. Annual billing saves up to about 17%. Prices may change with promotions.
Can you trade with TradingView?
TradingView is not a broker, but you can connect an account with one of the integrated brokers and send orders directly from TradingView. Alternatively you can use it only for analysis and trade on your broker's platform. There is also Paper Trading to practise with virtual money.
What languages is TradingView available in?
TradingView's website, platform and app are available in many languages, including English and Italian, as is most of the documentation.
What is Pine Script?
Pine Script is TradingView's programming language, now on version 6. It is used to create custom indicators, strategies with backtests and alert conditions. It is simpler than MQL or C# and is designed for traders.
How do I get the TradingView discount?
By signing up through the «Try TradingView» button on this page, new customers get $15 off their first paid subscription.